National Hurricane Center to issue new storm surge map
The official hurricane season officially starts on June 1, 2014. NOAA’s National Hurricane Center (NHC) will issue the new Potential Storm Surge Flooding Map for coastline areas at risk of storm surge from a tropical cyclone. This new map was created over the course of several years in consultation with emergency managers, broadcast meteorologists, and others.
The term ‘Storm Surge’ has been used for many years but is very much misunderstood. It is important to understand this concept since it is the greatest threat to life and property from a hurricane. It poses a significant threat for drowning as a mere six inches of fast-moving water can knock over an adult. It only takes about two feet of rushing water to carry away most vehicles including SUVs and trucks. Storm surge is defined as an abnormal rise of water generated by a storm, over and above the normally predicted tide. During the 2005 hurricane season, a 25-28 ft storm surge was estimated during Hurricane Katrina.
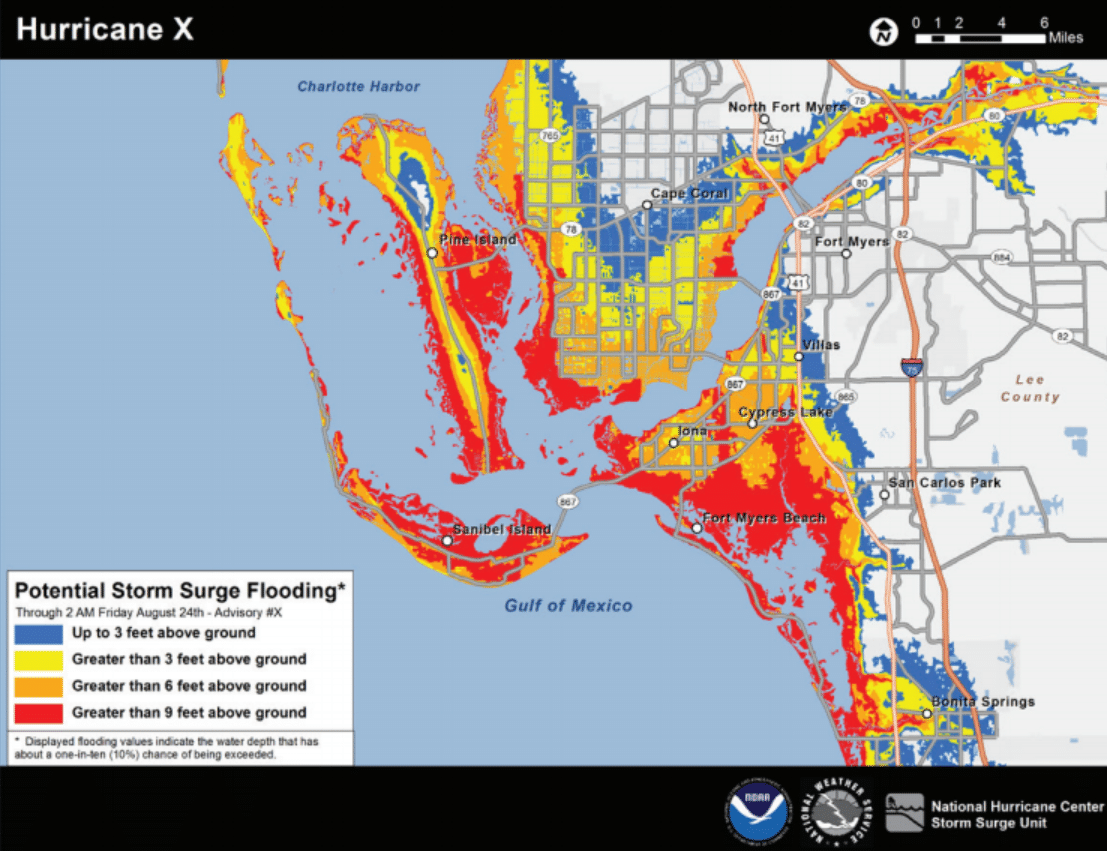
These new maps will help in a number of ways by incorporating the coastline topography, angle of approach, central pressure, along with storm intensity, speed, and size. The maps have been developed to help residents better understand how it may affect them based on their particular location. A color-coded map of the affected area will be released showing the potential storm surge flooding potential. Since the maps already take into consideration elevations above sea-level, residents will be able to estimate how high above ground the water could reach at their particular home.
The first map will usually be issued at the same time as the initial hurricane watch or, in some cases, with a tropical storm watch. The map is subject to change every six hours in association with every full NHC advisory. Due to the processing time required to produce the map, it will not be available until about 45-60 minutes following the advisory release.
The map is in a two years experimental study during which time comments from users will be solicited and gathered. At the conclusion of the experimental phase, based on the input, NHC will determine if the map would become an operational product.
The map will be available on the NHC website (http://www.hurricanes.gov) and distributed by local media outlets as well.